


Mettler-Toledo FY2024 Results
A Return to Positive Revenue Growth with Highest Gross Margins Ever


With a variety of products sold into the life science and pharma markets, Mettler Toledo (MTD) is one of many companies that has been dealing with an overhang from the COVID years of 2021 and 2022. MTD’s share price is still unchanged from what it was 3.5 years ago. I also wrote about three other such companies back in December.

Flat For Four Years: Hangover Stocks

There are many high quality businesses out there right now whose share prices have gone nowhere for the last four or five years. IDEXX, Brown-Forman, and Pool Corporation are just several. Despite the overall stock market making new all-time highs, these three companies have had the…
However, after MTD reported its FY2024 results last week, it finally looks like the business is turning the corner on a disappointing period of low and negative revenue growth. They now have two quarters in a row of positive total revenue growth after a trough that began in 2023.
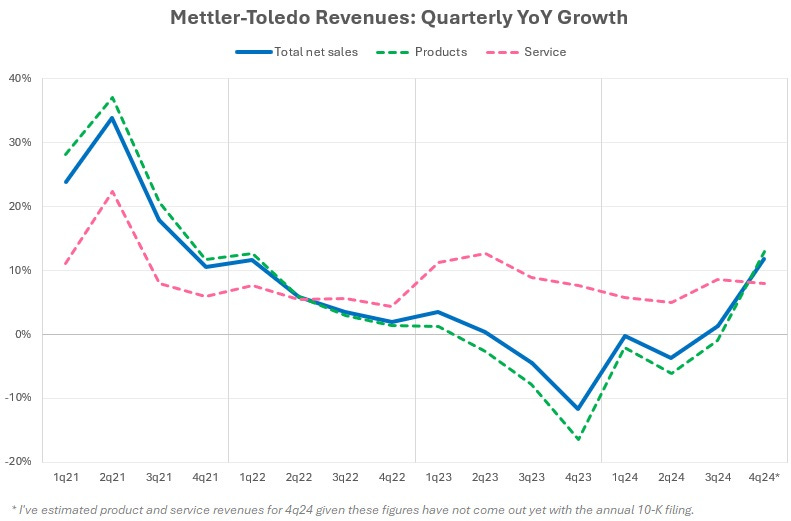
As you can see, revenues from services was quite stable even during this most recent challenging growth period. MTD has a global installed base of $16 billion worth of instruments and equipment in the field that needs regular service and maintenance.
An aside…

Many pure service businesses with built-in demand drivers have proven to be very resilient despite economic or end-market challenges. For example: Rollins (pest extermination), or Cintas (uniform rental and cleaning supplies), or Chemed (Roto-Rooter and Vitas Healthcare franchises). Rollins and Chemed powered through the Great Financial Crisis with positive revenue growth. Although Cintas had a brief period of negative revenue growth during the GFC, it's performance since then has been incredible.

Lawrence Hamtil mentioned Chemed recently in a blog entitled "The Implications of an Aged Housing Stock."

Preferred Shares did an episode on Rollins entitled "The Rat Man: Otto Orkin and the Birth of the Modern Pest Control Industry."

Andvari Associates also wrote about Rollins in their Q3 2024 letter.
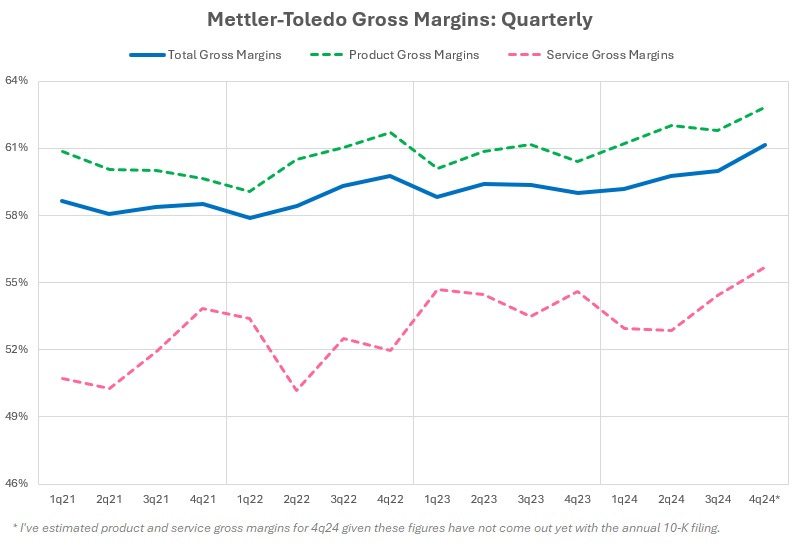
But even most impressive about recent results is that total gross margins continue to march upward and are hitting heights never before seen. Total gross margin for Q4 2024 hit 61.2%. Although MTD hasn’t yet broken out revenues and gross margins for products and services, I did my best to back solve them. Each also likely hit new all-time highs for gross margin.
The Simple Investment Case
As Andvari Associates wrote in its Q2 2024 letter:
Mettler-Toledo makes a variety of lab instruments as well as weighing scales for industrial and retail use. These products are essential to the end users and often required to comply with a variety of regulations. The company has the number one product in most areas where it competes. However, its market share ranges from 25% to 30% share in these business lines. This means, despite its top status, competition remains highly fragmented, which gives them opportunity to capture more share over time.
With an installed base of over $16 billion worth of machines across the world, revenues from services and consumable adds to the predictability of total revenues. Pricing power is strong given the high value and relatively low cost of their products to end customers. Mettler has consistently captured 200 basis points (or greater) of net pricing every year. The company even successfully raised prices during 2009.
MTD checks many of my boxes that mark a high quality business:
Highly regulated customers. MTD benefits from non-discretionary spending from its customer base. Its customers operate in highly regulated industries or where extreme precision, accuracy, or quality, are paramount.
Small percent of total spend. Add to this that MTD’s products and services are a small percentage of the total spend of a customer and you get a business with good pricing power and high margins.
Classic picks and shovels. MTD is not in the business of researching new drugs or manufacturing semiconductors, but they certainly sell the necessary supplies and equipment to these types of customers. Mettler’s products speed research and development, ensure safety and quality, and just generally aid in the saving of money for a diverse set of customers.
Low, but dominant share in many product categories. A constant refrain from management is how it has the top share in markets that remain highly fragmented. This is an opportunity for MTD to grow at an above average rate by taking or acquiring market share.
Servicing a large installed base. Again, MTD derives high margin revenues from servicing a $16 billion installed base. But its not just high margin revenues, the servicing employees also have an opportunity to generate new sales on the product side as well. Just being there in person can generate orders for equipment upgrades or replacements.
Capital allocation. The company still does not pay a dividend. Instead, it regularly repurchases shares and makes tuck-in acquisitions with its capital. Again, the company would rather spend money to take market share, acquire market share, and return excess capital to shareholders via buybacks. They’ve reduced the share count from 44.5 million in 2004 to 21.1 million today. It views dividends as an inefficient use of capital.
Long-Term Results

Getting back to the financials and how the qualitative business attributes have translated into quantitative results. Over two decades, gross margins have increased from 46% to now 60%. Amazingly, the service gross margins have improved an enormous amount—about double the amount of improvement of product gross margins over two plus decades. Adding to my amazement is that the service category tends to be a place where some companies deliberately keep margins lower than they could be as a way to generate more revenues. This suggests that MTD’s service business is able to provide extraordinary value to its customers given its stable growth and extremely high margins.

I’ve already stated the many qualitative reasons gross margins deserve to go higher. There are just so many aspects of the business that leads to MTD having great pricing power. But the way this mechanically works is that MTD can simply increase gross profits at a faster pace than revenues. Below is a chart showing 2-year incremental gross margins. It’s just beautiful.

Note well: the negative periods of 2010 and 2024 simply show that incremental revenues shrunk during that period while gross profits grew—an unusually tough feat for any business. On average, the two-year incremental gross margins have been in the 50-60% range for nearly two decades.
Summary
I can remember back in 2014 or 2015 studying MTD. I know I must have thought to myself that a mid- to high-teens EBITDA multiple was certainly too expensive for an investment. But since then, the EBITDA margins increased from the low 20s to now the low 30s while revenues have gone from $2.4 billion to likely $4 billion in the next 12 months. The multiple ballooned to nearly 40x during the COVID period and then dipped below 20x at the end of 2023.
At current prices, we can invest in a company at the same multiple (albeit seemingly high) last seen in 2017, but now its a business with greater revenues and higher margins. It has exhibited an adroit ability to push margins higher. It sells essential products and services at continually higher price points over which few customers care to negotiate aggressively. Here’s to hoping I can make up for my past transgression of failing to invest in a great business at a decent price.

Please Subscribe
If you enjoyed this content, please share and subscribe.
Disclaimers for this Substack
The content of this publication is for entertainment and educational purposes only and should not be considered a recommendation to buy or sell any particular security. The opinions expressed herein are those of Douglas Ott in his personal capacity and are subject to change without notice. Consider the investment objectives, risks, and expenses before investing.
Investment strategies managed by Andvari Associates LLC, Doug’s employer, may have a position in the securities or assets discussed in any of its writings. Doug himself may have a position in the securities or assets discussed in any of his writings. Securities mentioned may not be representative of Andvari's or Doug’s current or future investments. Andvari or Doug may re-evaluate their holdings in any mentioned securities and may buy, sell or cover certain positions without notice.
Data sources for all charts come from SEC filings, Koyfin, and other publicly available information.