Mastercard's Overlooked Metrics
To be clear, this is not an in-depth write-up on the investment case for Mastercard. That might come later. With this post, I discuss what I think are some overlooked metrics that are the result of Mastercard’s scaled payment network.
Background
Formerly an organization mutually owned by a large collection of credit card issuing banks, Mastercard went public in 2007. No longer beholden to its bank shareholders, Mastercard had free reign to maximize the long-term value of only Mastercard, and thus embarked on a long journey to do just that. Through acquisitions and reinvestment back into its business, Mastercard has continually sought to increase the value of both its payment rails and the many value-added services it provides to its customers.
Transaction Growth is the Evidence of Customer Value
I believe one of the strongest barometers for whether Mastercard is creating value for customers is whether the number of transactions on its network is increasing. If customers found little value in doing business with Mastercard, transactions would stagnate or decline, and in turn so would Mastercard’s revenues and profits.
On the metric of transactions, Mastercard has had extraordinary success.
In 2007, the total worldwide purchase transactions using Mastercard’s network was a measly 23.8 billion. In 2023 alone, Mastercard recorded an increase of 20.8 billion in the number of worldwide purchase transactions on its network, from 150 billion in 2022 to 170.8 billion.
More Cards, Less Cash
But we can’t just stop at Mastercard’s numbers. Let’s look at data from the Federal Reserve Bank of San Francisco. They’ve conducted an annual survey of consumer payment choices since 2016. The chart below shows credit and debit cards had a combined share of 45% in terms of all available payment types in the United States. In just six years, this combined figure grew to 60%.
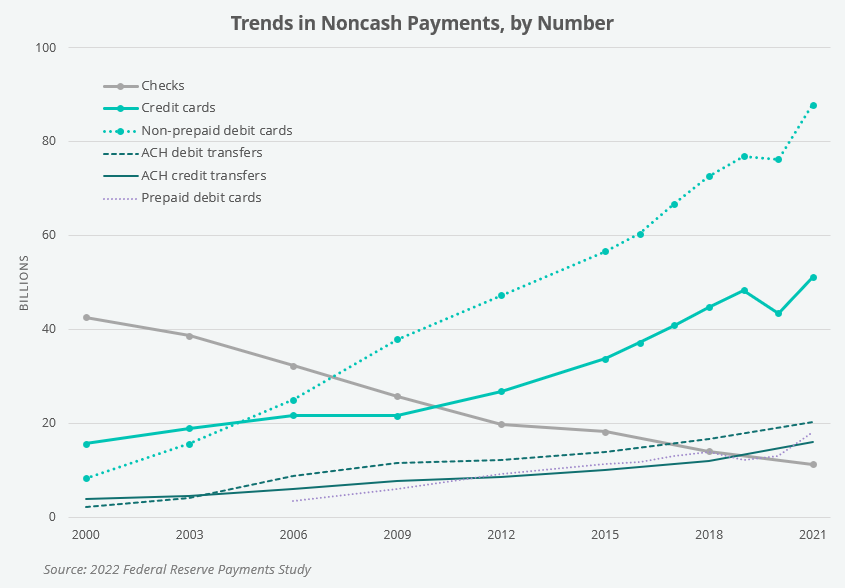
More data comes from the 2022 Federal Reserve Payments Study. This chart shows the trends in just noncash payments by number of transactions. Again, we see a steep rise in the popularity of credit and debit cards while more traditional methods have declined or failed to keep up the pace.
Simple Explanations for Credit/Debit Popularity
There are many explanations for the increase in use of credit and debit cards, but they all boil down to utility. The increase in online shopping over the last 15 years might be the primary contributor to the popularity of cards—it’s just impossible to use cash or check to buy something online! With many credit cards, consumers also have the opportunity to earn rewards or cash back.
Advancements in payment technology is another factor. Contactless payment technology has only in the last several years become mainstream in the U.S. despite being rolled out since 2015. Thanks to contactless, debit/credit cards are even more convenient to use in-person, whether at a physical store or in an increasing number of major public transportation systems. According to Sachin Mehra, CFO of Mastercard, on July 31, 2024:
“Card present growth was aided in part by an increase in contactless penetration as contactless now represents approximately 69% of all in-person switched purchase transactions.”
Faster, easier payments drives consumers to use cards more frequently. Like having a newspaper delivered to a mailbox, the days of using cash or check will only be a memory to those of certain prior generations.
But at What Cost?
Although more transactions enables Mastercard to earn more revenues, has this translated into profits? Although customers and end users have received value from Mastercard, have the shareholders of Mastercard received adequate value in return?
The short answer is “yes”.
Over the last 16 years, through the great financial crisis of 2008-2009 and through a global pandemic, Mastercard has grown revenues from $4 billion to $25 billion and has doubled its EBITDA margins from 30.2% to 61.1%. The returns to shareholders have been equally exceptional over that time.
So how have margins doubled over this time period? The answer lies in a scaled, trusted network with a plethora of value-added services attached to it. The marginal cost to take care of an additional transaction, let alone another few million, is extremely low. Mastercard’s investment in its enabling infrastructure—we measure this as the combined spend on capex and capitalized software—stands at just 4.3% of their total 2023 revenues. The benefits of scale will continue as Mastercard spreads its costs across a growing avalanche of transactions.
Expenses Per Transaction
Now we are finally at the overlooked metric I find useful in illustrating how Mastercard has achieved its extraordinary margins: the reduction in its expense per transaction. It’s a more precise way of saying “economies of scale”.
The chart below shows both the total operating expense per transaction (excluding litigation provisions and charitable contributions) as well as just the processing expense per transaction. (Please note that Mastercard labels what we describe as “processing expenses” as “data processing and telecommunications” expenses).
There has been a steady, long term decline in total operating expense per transaction. In 2007, it cost Mastercard about 12.3 cents to process every transaction in its network. This declined to just 6.2 cents per transaction in 2023. In other words, transactions have grown faster than total operating expenses.
The next chart is a simulacrum of the prior chart. This one shows the growth of transactions and total operating expenses (excluding litigation provisions and charitable contributions) with both indexed to 100 in 2007. We see that transactions in 2023 were 7.2x greater than in 2007 while operating expenses were just 3.6x greater than in 2007.
We can also dive a bit deeper into some of the operating expense categories. Although growth in processing expenses have kept up with growth in transactions, one line item that has benefited tremendously from scale is marketing and advertising. In its time as a public company, the largest amount Mastercard ever spent on this line item was in 2007: a grand total of $1.1 billion (26.6% of revenues). In 2023 the spend on marketing was $825 million (3.3% of revenues). The marketing spend as a percentage of revenue has declined significantly over time, which has contributed meaningfully to Mastercard’s margin expansion.
Summary
To summarize, here’s a great passage from page 100 of Joe Nocera’s book, A Piece of the Action (published 1994), about credit cards and processing:
“It’s a complicated array of things you don’t see, but it all happens so quickly and smoothly that you don’t even think about it. Here, then, was another paradox: computers weren’t important only because they managed highly complex tasks; they were important because they disguised highly complex tasks. By making a complicated process invisible, computers allowed people to forget about the complexity, and focus instead on what was visible: namely, how easy the thing was to use.”
Payment cards have become ubiquitous thanks to convenience and ease of use. Nilson Report says there were 26.71 billion payment cards in circulation worldwide at the end of 2023. They predict that number will reach nearly 30 billion at the end of 2028. As of right now, there’s 8.1 billion people alive on this planet, so it’s amazing there is still room to grow the number of cards in circulation.
Since its IPO in 2007, Mastercard has played its part in the war on cash, investing billions to accommodate more transactions and more payment methods. As it has invested in capacity, Mastercard’s financials have benefited greatly from its growing scale and the value realized by its customers. Operating costs per transaction has halved from 2007 to 2023. We believe they will slowly decline for years to come.
Please Subscribe
If you enjoyed this content, please share and subscribe.
Disclaimers and Notes
The content of this publication is for entertainment and educational purposes only and should not be considered a recommendation to buy or sell any particular security. The opinions expressed herein are those of Douglas Ott in his personal capacity and are subject to change without notice. Consider the investment objectives, risks, and expenses before investing.
Investment strategies managed by Andvari Associates LLC, Doug’s employer, may have a position in the securities or assets discussed in any of its writings. Doug himself may have a position in the securities or assets discussed in any of his writings. Securities mentioned may not be representative of Andvari's or Doug’s current or future investments. Andvari may re-evaluate its holdings in any mentioned securities and may buy, sell or cover certain positions without notice.
Data sources for all charts come from SEC filings, Koyfin, and other publicly available information.


Interesting! It's fascinating to see how their focus on reducing operating expenses per transaction has significantly boosted profitability.